


Color Speckle Measurement Software
Color Speckle Measurement & Analysis
|
|
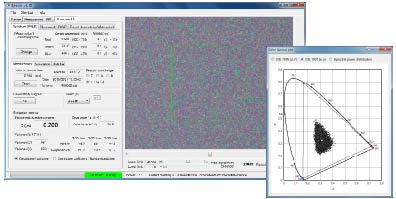
Operation window of M-Speckle software |
| We have launched brand-new color speckle measurement technology! Speckle noise of white screen on laser displays can be measured. |
|
Features
|
Operation mode
-
Measurement mode
Automatic red / green / blue speckle image capturing with filter wheel control option -
Simulation mode
Simulate color speckle distribution from the values of red / green / blue speckle contrast -
Analysis mode
Recalculate color speckle distribution by loading saved data of measurement mode
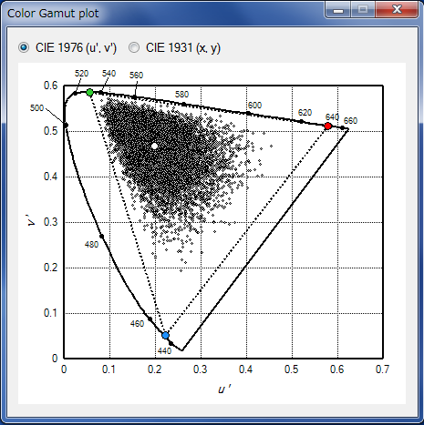
Graph drawing
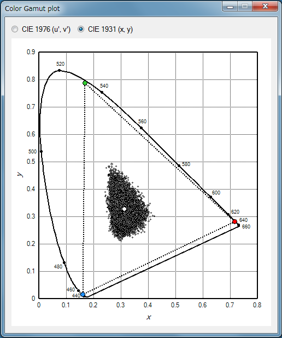
Two types of diagrams are selectable
*Below are the case of CR = CG = CB = 0.5
 |
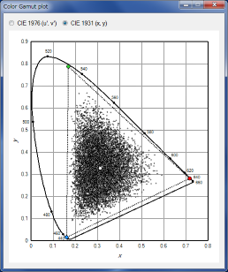 |
| CIE 1976 color system (u’, v’) | CIE 1931 color system (x , y ) |
Evaluation metrics of color speckle distribution
- Covariance μu’v’ , variance σu’2 , σv’2 , and variance in a parallel or perpendicular direction to the line passing the light source point and the target chromaticity point in the CIE 1976 chromaticity diagram (u’, v’).
-
Photometric speckle contrast Cps = σy/⟨Y⟩ , where Y is the tristimulus value.
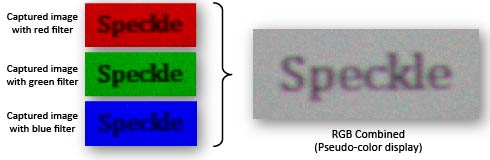
Pseudo-color view of speckle pattern image
Each Red / Green / Blue speckle pattern image can be displayed in pseudo-color. Combined RGB image display in pseudo-color is also possible.
Color_speckle_optional_software_EN.pdf